Now we have the internet, it is relatively easy to collect temperature and power readings from any equipment, and to send it to [amps] website for viewing anywhere.
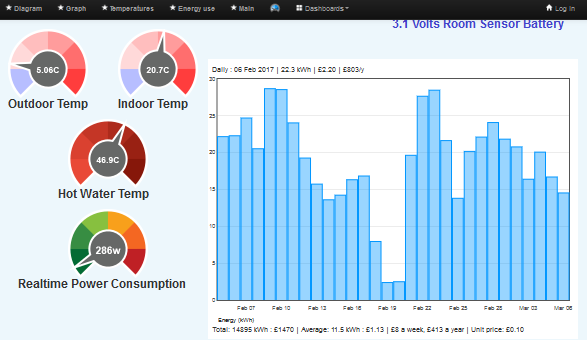
Many manufacturers have developed such systems to monitor their equipment. Not only does it help the owner to understand how the system is working, but it also helps the installer to see how well their installations are going. It also lets manufacturers keep an eye on how their equipment is being used.
 Mitsubishi have developed a system called Melcloud If you have a Mitsubishi Ecodan, then you can probably fit this monitor. It sends basic operational information to both a website and a smart phone.
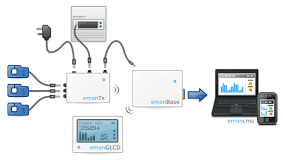 I have been working with OpenEnergyMonitor.org who have developed some very universal monitoring systems that are a Open Source. They also have an on-line shop where various monitor products can be bought. There is quite a learning-curve here so don’t underestimate the learning time that might be required to get a system up and running. However, it is very adaptable and can be used as a very comprehensive diagnosis tool. On the other hand it can be used in its simplest form to measure real-time input power and various temperatures.
See my YouTube video
Things to measure
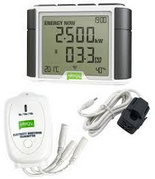 In its simplest form, a simple power measuring device that displays the power consumption of your heat pump can be very useful. If you know how many units (kWhs) of electricity your system is using. This may help you puzzle out the best way to control your system. (most use a CT clamp around a single cable, and often measure current a. This approximates to power inKwatts).
Other systems can measure the pulses from a normal electric meter. This is gerenally more accurate since it is a true power (kW or kWh) reading.
Since the energy-efficiency of a heat pump is greatly affected by the working temperatures, it is very important to know the temperature of various things, for example;
- The heated water flow and return temperatures
- The source inlet and outlet temperatures
- The cylinder temperature
- The outside temperature
With this information, we may see patterns and trends that can point towards improvements to the running of the system.
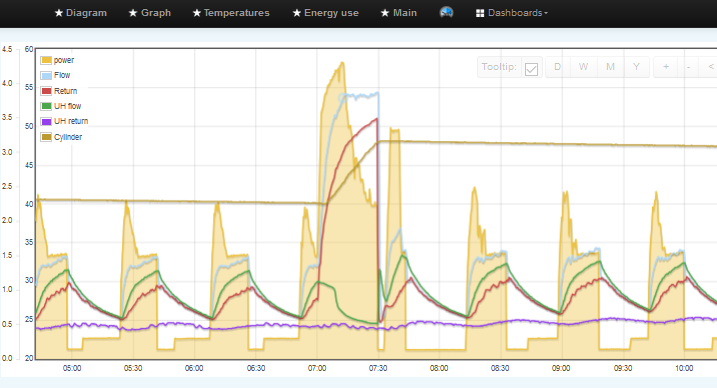
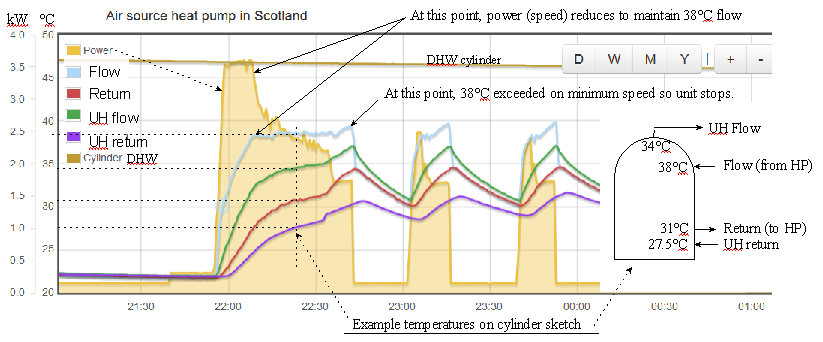
This example of an OpenEnergyMonitor dashboard shows an ASHP operating. The buff-coloured areas show the power input in kWatts. The coloured lines are temperatures. We can see here a healthy water flow-rate since the difference between the flow and return is 5 degrees. It is also alerting us to high standby power. i.e. the area of buff (energy) when the system is at rest is not insignificant compared to the total area of buff (total energy). The underfloor return temperure looks most unhealty with a low flow rate. This requires attention.
These systems are still being developed. Unfortunately, we are not offering a monitoring service, but showing these examples for those who are able and willing to attempt their own monitoring systems.
Below is another analysis – this time with a buffer tank
