Climate Change Effects
Large amounts of energy are used for heating our houses, and our initial focus should be to minimise the heat requirements by normal conservation measures like insulation. This is certainly the best and simplest first-step. Sadly, we cannot all live in super-insulated eco-houses, so significant amounts of heat energy are still required for many building. That said, never lose sight of the advantages of minimising your energy needs.
In the UK the vast majority of homes are heated by natural gas (e.g. North Sea) since this has been the cheapest method. Remote locations where mains gas is unavailable are commonly served with Oil or LPG (Liquefied petroleum gas). Electricity may also be used for direct heating, but generally, even off-peak electric heating is an expensive method to use.
Electricity is generated nationally by a ‘mix’ of methods, namely; Gas, coal, nuclear and renewables. Each country will have a different mix. The general trend is an increase in renewables and a reduction in coal
The UK National Grid gas been getting increasingly de-carbonised, so CO2 figures have dropped in recent years. The 2020 value is around 0.25 kg CO2 produced per kWh of electricity. This varies over time depending on the total mains demand and the amount of renewables available. This interesting page – Mygrid-GB shows the figure right now.
The process of generating electricity is not highly efficient, so not ideal since the heat wasted in the process is rarely recovered. Electricity is therefore not the best form of energy for heating. However, the energy-advantages of heat pumps should more than compensate for these inefficiencies, and makes them score very well with respect to CO2 emissions.
The Sankey diagrams below illustrate the total energy flows starting with the input fuel. The useful end result is to the right. I have not shown a conventional condensing boiler which may deliver up to 90% efficiency in practice (the same efficiency as displayed in the historical 1st example below) .
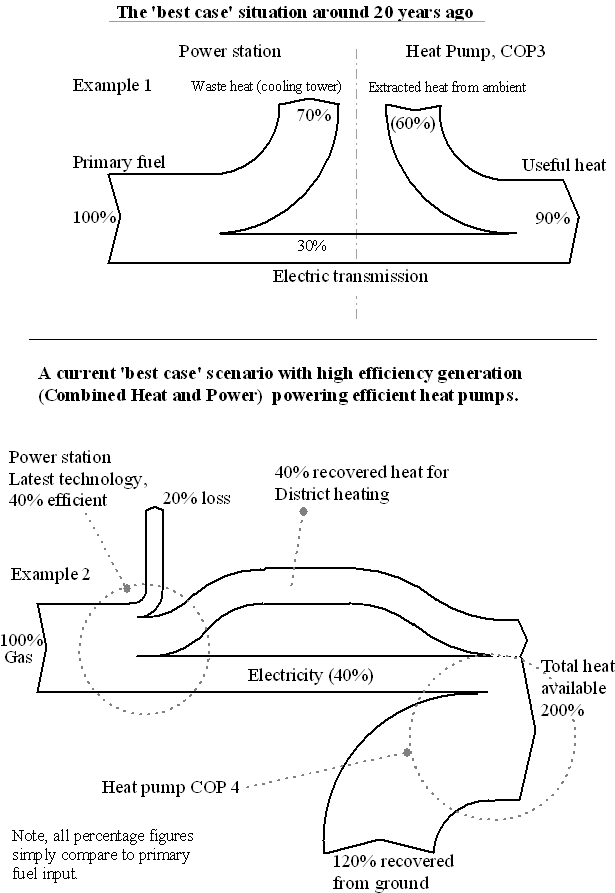
As can be seen, in the past, The CO2 figures for a heat pump would be similar to a good boiler system. However, we now have better power stations, more renewable mains electricity, and better heat pumps.
Note: The assumption that you can sign up to ‘green’ electricity and become ‘carbon neutral’ has not been made here since electricity all comes from the same ‘pot’. By claiming your electricity is ‘green’ relies on others using ‘non-green’ electricity. However, it is clearly an advantage to buy electricity from a genuine source of lower-carbon generated electricity.
The following graph shows CO2 emitted from various fuels. The official average figure used for UK electricity generation has varied quite a bit. It has been as high as 0.5kg CO2 released per kWh of electricity generated. However, our use of coal has dropped and renewables are now having an effect. I believe that we are now down to figures below 0.3 kg CO2 /kWhe. It is predicted that electricity will get cleaner in the future, and these figures will reduce over the lifetime of a heat pump installed now.
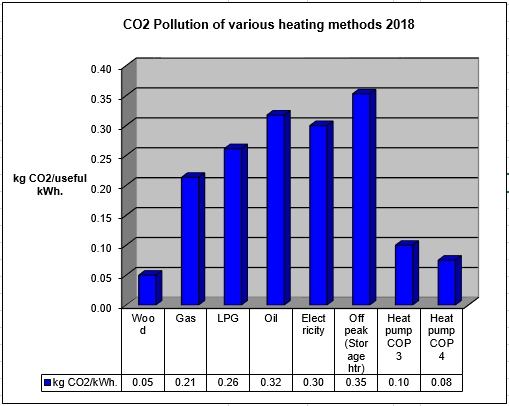
The COP (efficiency) for a typical Ground Source heat pump in an older building with radiators should be around 3, but in a well-designed underfloor new-build the efficiency can be 4. As can be seen, currently, a heat pump with COP of 4 is 40% lower in CO2 than that of a gas system. The figures for wood burning seems to be a very contentious issue. At best, locally sourced scavenged wood in rural areas should be in the region of 0.02 kg CO2/kWhe, and are an ideal companion to a heat pump system. Worries about particulates and poor combustion is a concern. Wood fuel must be nicely dry and appliances should be of good quality and in good order.
Notes and assumptions.
- Electricity generated at 0.3 kg CO2/ kWhe during worst times.
- Gas condensing boiler efficiency 88%
- Oil boiler efficiency 87%
- LPG condensing boiler efficiency 88%
Electricity heating is 100% efficient at point of use. Off-peak use is less efficient due to warmer-than-needed average house temperature, however, electricity is generated ‘cleaner’ at night.
As can be seen, the carbon dioxide contribution from a good heat pump system can be 1/3rd to 1/4 that of oil or LPG. Direct electric heating, especially storage heaters, scores very badly with respect to global warming.
Even though the UK’s MCS Heat Pump Standard does not allow a design to use electric ‘back-up’, some heat pumps incorporate such a heater to cope with the coldest periods in the winter. This is more likely the case with air-source systems since the period of highest heat-demand also corresponds with the time when there is minimum heat available in the air. Therefore, on the coldest day the electricity consumption for some heat pumps could increase many-fold, putting a strain on the electricity supply grid. It would be better to use boilers, or wood stoves as a back-up. It should however be noted that the total annual contribution by top-up heaters can be surprisingly small if it is used and set up correctly.
The COP (coefficient of performance) is a measure of the energy-efficiency of a heat pump. It is the ratio of heat output divided by the electrical input. (COP = kW heat output / kW electric input.
Fuel figures SAP 2009.
The Graph below might be useful when assessing the benefit of running a heat pump. (it’s not as complicated as it looks!)
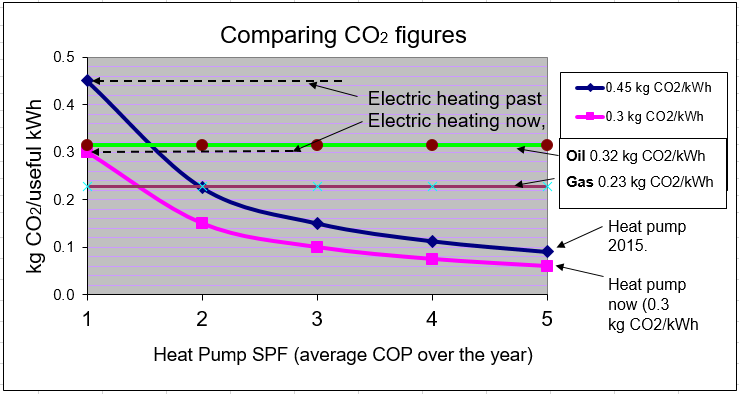
The vertical Y scale on the left shows CO2 pollution per kWh of useful heat (allowing for losses). The two horizontal lines show figures for mains gas and oil heating. The curves are for heat pumps with COP’s up to 5. Direct electric heating has a COP of 1, and this is shown on the left.
Given current electricity figure of 0.3, the graph purple line shows us that we can halve the CO2 figure of gas with a heat pump COP of 3 This is a significant advantage.
Click below for some amazingly useful tools that gives actual UK generation CO2 figure
Real time grid carbon app Carbon trends… Mygrid. very interesting
Ecotricity grid carbon website Mygrid-GB Lice CO2 figures