This is an old blog but may be of interest to a few
OpenEnergyMonitor are going strong. See 2020 update here
OpenEnergyMonitor are going strong. See 2020 update here
Summary of a brief presentation at the Ground Source Heat Pump Expo at the Ricoh Arena on the topic ‘Energy or Performance Monitoring’, so its timely to do a little blog here to elaborate on some of the examples I will be showing from some OpenEnergyMonitor dashboards I have been using
Note; The below are just examples for this blog, and don’t necessarily show the whole story.
I have been working with OpenEnergyMonitor for some time, and now have various installs using OEM kit from Megni.co.uk
In brief, most of the systems I have installed use around 8 temperature sensors, CT power measurement with voltage sensing (real power including power factor), and/or pulse counting from standard electrical kWh meter. I have used Grundfoss VFS flow sensors, but we are currently working on the direct interrogation of a Kamstrup heat meter, giving heat output
Data is sent via Ethernet to www.emoncms.org and displayed on dashboards (as samples below). These real-time graphs give a fantastic tool for the installer and the home owner. They show exactly what is happening now, and what has happened over the previous hour/week/month or year. The information can be used to improve the design of a system and also be used to fine tune the user settings.
Let’s start with a SIMPLE dashboard example
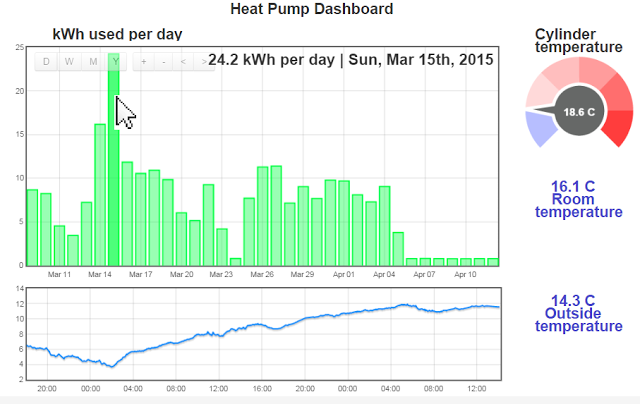
This type of dashboard can be accessed on any internet-connected computer using www.emoncms.org e.g. www.emoncms.org/example
The dashboard above shows a bar graph of daily energy input to the heat pump. This can be checked periodically for unusual values. It is showing high use on 15th March. By mousing-over the graph we can see that on this day, 24.2 kWh were used. The reason for this high use could be investigated. The time period can easily be changed to anything you wish by zooming in or out. Below this is the outside temperature. This might be interesting on its own right, but may be interesting if compared to energy used per day. To the right are a few useful dials and figures – cylinder temperature, room and outside temperature – things any home owner might like to know. We can see that as from 6th April, the system is switched off.
This type of simple dashboard is ideal for the home owner, but we can make as many dashboards we like, of varying complexity and detail. These are very useful for installers and designers, and a far more in depth analysis can be made.
Let’s start with a good example of a GSHP connected to underfloor heating.
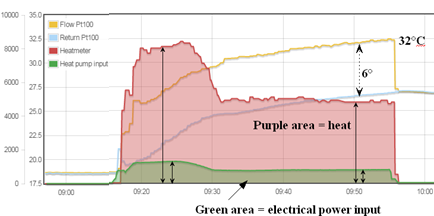
This is a 12kW (max output) inverter-drive GSHP operating for a 40 minute period here. The green area represents electrical input and the purple represents heat (direct reading from Kamstrup meter). The ratio if these two areas gives the COP. We can see the flow and return temperatures slowly ramping up to a final flow temperature of only 32°C. Since this is September, the ground collector is exceptionally warm. This, along with the low flow temperature explains why the COP is currently almost 6. Current conditions are ideal, but from tests earlier in the year, we expect to see average COPs for heating in excess of 4.
This graph is showing us a healthy flow-return dt of 6 degrees. It is also showing how nicely the speed of the compressor drops in response to the rising flow temperature.
Below is another snip. This time from a fixed-speed GSHP. This one shows the source temperature too.
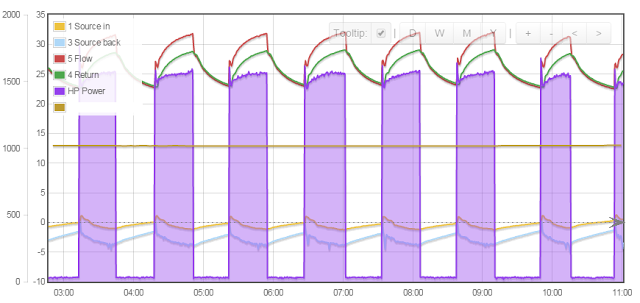
This shows a period of about 1/3rd of a day, and approx. 30min. run durations which is quite acceptable. The flow and return is nice and low, with average flow temperature around 30C. The underfloor is a good design here, but he source is dipping below zero. This is not ideal, but a zoom-out of yearly temperatures and knowledge of total heat used would give better understanding. In this case, since the underfloor is so good, it may be acceptable to have a slightly inferior ground source.
Next, a good example of a GSHP heating a domestic hot water cylinder. The cylinder is copper with the heat exchanger coil in the bottom section of the cylinder. The heat pump is only 3.5kW and the coil is a nice large 3sq m.
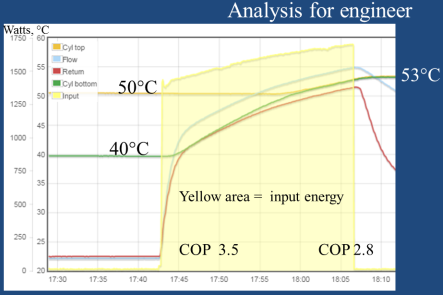
This example is showing the heat pump electrical input power as the shaded yellow area (no heat meter fitted). The heating period starts at about 1.3kw input and finishes at around 1.7kw. It also shows four temperatures; cylinder top and bottom, and the flow and return temperatures.
This graph is showing the early evening heating period having been off by a time clock.
As we can see, the top of the cylinder is still at a useable 50°C before heating, but the bottom has dropped to 40°C. The 24 minute heating period shown here starts by heating the bottom water from 40°C. Indeed, this system has been set up carefully to ensure the system heats from a lower starting temperature. The heat pump ‘sees’ flow and return temperatures of only 45/40°C at the start. The 40°C cylinder bottom (not very hot) ‘pulls down’ the heat pump working temperatures, resulting in a high energy-efficiency. By looking up the heat pumps performance data, we can estimate the average COP with reasonable accuracy; here it is about 3.5 at the start of the heating-up cycle.
As the cylinder warms, we can observe the point just before 18:00 where the bottom is becoming warmer than the top, and natural convection causes the top of the cylinder to rise with the bottom. After about 25 mins the whole cylinder has reached about 53°C. At the end, the heat pump ‘sees’ temperatures of 55/52°C. This is getting quite hot, and getting close to the limit of the heat pump’s comfort zone. The COP here may be about 2.8. (taken from heat pump data). We can then look at the period of time the heat pump has spent at different COPs, and estimate the COP for the whole DHW heating session. Its somewhere around 3.05.
If the system were enabled 24/7, and the sensor position not optimised, the lower cylinder would not drop so far, so the cylinder would heat more frequently from a higher starting point. The average working temperature would be much higher, so COP would be lower. At worse, the COP could be not much better than 2.8. Added to this, losses from the pipe run, and starting-up losses could result in worse performance.
We can therefore use the monitor to enable us to set the system to operate at a low average temperature, but for the cylinder top to remain at a useful temperature (e.g. say 47°C).
We can also see how nice and close the final cylinder temperature (53°C) is to the maximum flow temperature of the heat pump (55°C). This minimises the need for immersion heater (with COP of only 1). In this case, the compact copper heat exchanger is exceptionally large compared to the heat pump size, and the coil is also only occupying the lower section of the cylinder. This gives exceptionally good results, and allows us to heat some of the water in a ‘batch’ from a colder starting point.
For the next example we have a complete contrast. This is a very inefficient system!
This one is a 14kW ASHP. The heat pump is fine, and function exceptionally well, but the cylinder heat exchanger is debatably a little small for this big heat pump.
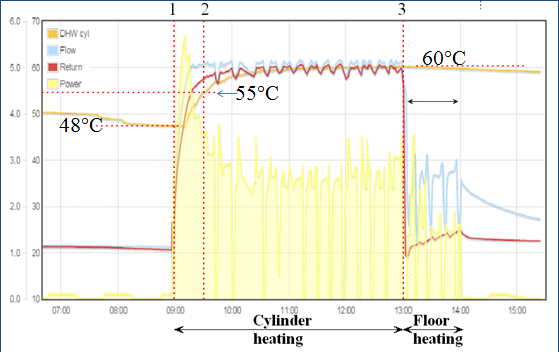
Looking at the graph, heating starts when the middle of the cylinder is 48C. the flow temperature s runs up to 60C within 15mins, at which point, the input power drops and the heat pump ‘tracks’ the 60C flow temperature. After 30mins running, the cylinder is 55C. The flow temperature here is considerable higher than our previous example. In part due to the heat pump NOT reducing its speed, and in part due to the smaller heat exchanger coil, but it has not done too bad.
However, the period after 55°C is clearly grossly inefficient. We can see that the compressor switches off frequently and spends the next 3.5 hrs! attempting to achieve 60°C. The other thing to mention here is that the distance between the heat pump and cylinder is around 15m. What is actually happening is that most of the heat is simply being lost from the pipe run. The energy consumed is shown by the yellow area of the power plot. The final 5 degrees (to 60C) uses several times the power (area) of the first section from 1 to 2.
The biggest problem here is poor use of the controls.Clearly, it would make a lot of sense to adjust the hot water setting to 55°C so that the heat pump stops. .
The final ‘floor heating’ period is just as terrible as the DHW period. Here, only 1 or 2 underfloor zones are open so the flow rate is far too low, as can be seen by the large temperature difference between the flow and return. This is in excess of 10 degrees. Again, heat dissipated by the floor is far too small for this large heat pump.
This is a clear case of an over-sized heat pump connected to a cylinder and emitter system. A smaller unit would work far better.
Finally, just to top anyone up with a little heat pump theory, I am adding a graph that I used to illustrate heat pump efficiency v the output temperature. If there is one thing to learn about heat pumps – LEARN THIS.
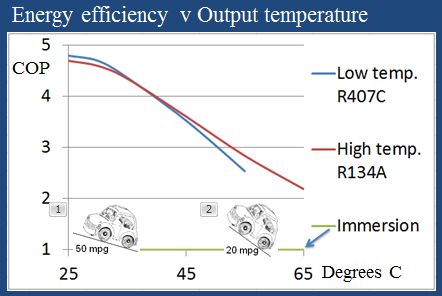
Here we have the characteristics of 2 sample heat pumps. The vertical Y axis shows the efficiency, the COP. A 3kW immersion gives 3 kW of heat. It has a COP of 1. Heat pumps give out more heat than they consume because they extract heat from outside. The X axis shows operating output temperatures ranging from tepid on the left to very hot on the right.
I am showing 2 typical heat pumps. A typical (R407C refrigerant) unit can reach say 55°C, whilst a ‘high temperature’ (134A refrigerant) unit may achieve 65°C. Anyhow whatever type, we can see that to the left, where the water is lukewarm, the heat pump has an easy time, hence the COP is very high (1kw in for 4.5kW of heat). I liken this to driving a car up a slight incline. We should get good fuel economy here, maybe 50mpg . However, it we heat up to 65°C, the temperature ‘lift’ is great, and this is a little like driving a car up a steep incline – we are in a low gear and the MPG is only 20!. In the same way that you will NEVER get good fuel economy when driving up a very long steep hill, you will not get a good COP when heating to a high temperature. That said, it should always be better than using an immersion heater.
So, knowledge of the performance of any heat pump should be understood, and data should be available for all models relating to output temperatures at specific ground source or air-source temperatures.
If you have a high temperature heat pump, it doesn’t mean you always have to operate it at a high temperature. If you operate it at lower temperatures, the performance should be far better. It is however always a good idea to find out the working limits of you unit.
Some of you may have wondered about the flattening of the curve at very low temperatures. I have drawn it that way because some heat pumps are not very good at the extremities (limits) of their performance. However, I am finding (and partly guessing) that most inverter heat pumps with electronic expansion valves work very well over a very wide range, so some heat pumps will easily exceed COPs of 5 in ideal conditions (usually late spring or autumn, when not much heating is needed) .Never forget mid-winter conditions – this is the time we need most heat, so the operational area to focus on.
So, it is with an understanding of the characteristics of heat pumps, performance monitoring can be used to great advantage. In general, we want heat pumps to spend as much time at lower output temperatures ( and high source temperatures) as possible.
Hi John,
Many thanks for your reply. We are installing an 11.2 kW Midea pump for our Hybrid / bivalent system (It is being installed as I write!) I have tried to get details from Midea (and their supplier, Freedom) to see if they can provide any Cop details at varying outside and flow temperatures, but no response yet!
It becomes a little more pertinent with the current rise in electricity prices and, of course, the likely uplift in April and beyond.
Thanks again – Andy Main
Hi John,
A very simplistic question, which you have probably answered elsewhere: Most ASHP give details of their SCOP at various temperatures ie, 7 degrees external and 35 or 50 degrees flow temperature. Is it possible to extrapolate the actual efficiency at other external temperatures, in order to calculate real time efficiency? I ask, because we are installing a hybrid / bivalent system and it would be useful to find an external temperature at which point it would be more efficient to switch back to our oil boiler.
Good but difficult question. Everyone (I included) seems to avoid question ‘what is actual COP v theoretical COP. In steady-state (heat pumps purring steadily and constantly) then its easy-ish to estimate COP, BUT depending on inverter speed, it will vary. Generally the COP drops a bit at max an minimum speeds, but this wont be true for all models. Further to this, if you look at real-time graphs, you don’t often see steady state. Given that a lot of heat pumps seem to be quite big (relative to heat demand), then for some systems a lot of time is spent between minimum and off. COP can drop considerably. Given all that, its not easy to give a temperature where its better to go for gas etc.
All that said, you should be able to extrapolate, and using the Carnot COP may be a good way of doing it (My book page 95) if you add 272 to operating temperatures, then CarnotCOP = T(Hot), [flow temperure plus say 5], divided by [T(hot)- T(cold) . [T(cold) = air temp minus say 7degrees. This gives you ‘perfect COP. 1/2 it for approx actual COP. Use carno cop to estimate %age change if you change operating temperatures conditions. Now apply same %age to the SCOP rating.
Dear John,
Many thanks for your reply. Your explanation, using the Carnot COP makes perfect sense.
I wondered if a more ‘belt and braces’ approach, might be to install a meter, to measure the power-in and compare it with the deemed power-out (in my case 11.2 kW) which I assume the pump will try and maintain over a period of time, irrespective of the outside temperature.
Thanks again – Andy Main
Its definitely worth fitting a heat meter if you think its worth the expense. This is the only way to really know what is going on. What model do you have? I have been looking at real COP values recently using OpenEnergyMonitor Mbus devices. I have been noticing some steady-state periods with excellent COP, and other periods with lower results that expected.
Hi John,
As you say, the ideal is for the heat pump to ‘purr steadily and constantly’.
What’s your thoughts on increasing your thermal storage, i.e. to super-size your buffer. As long as the thermal store is well insulated, isn’t it better to heat a large quantity of water (‘purring steadily and constantly’) , then to switch the heat pump off completely and to circulate the water through the UFH until it has given up its heat, thereupon to switch the heat pump on again to heat the store again.
I have a GSHP and wonder whether I could manage to run my GSHP at night on cheap off-peak electricity to heat a large thermal store… and then switch the GSHP off during the day (and use the heat in my thermal store to heat my house).
Do you know of any installations like this?
Hi John
It’s a dimplex LA16MI inverter
We’ve settled on target hot water temp in the tank of 47C ( as measured by the ntc mid point of tank, real temp feels like it might be higher ??)
Water plenty hot enough for shower & bath, cycles a bit towards the end of water tank heat up cycle.
The data you’ve published here has helped us take a system that was poorly set up to one that now comfortably & cheaply heats the house & heats the water. Our install & house had all the correct elements for success, a very well insulated house almost passivhaus design, air – air heat exchanger, air tight, great insulation..underfloor heating through out….but had never been set up correctly. Bypass valve not set up, manifold flow rates all over the place, some zero, very low water flow rate, so low the heat pump tripped quite regularly on low flow, internal 6KW boost heater on 24/7 oh, and carpet so thick the underfloor heating didn’t have a chance. We’ve spent the summer sorting all of the above. It’s our first winter with it working, fingers crossed it’ll hold up to a nice snowy Yorkshire winter
Thanks again for your help, our problems kicked off during lockdown this year when we moved in, we had no choice but to sort it ourselves…
John
Thanks for publishing this data – it’s been hugely useful helping us set up our ASHP heated house.
We’ve got a 16KW ASHP heating a fairly large well insulated house, the heating is now working really well…low flow temperatures ( 30C water flow @ outside air temp 10C ) good house insulation, underfloor heating – happy days, nice and warm & sensible energy bills
Quick question for you, on your example above of a small heat pump heating the water tank successfully without extended periods of cycling, what’s the water capacity of the tank ??
We’ve got a 300L tank 3.2m2 coil, with our 16KW ASHP after about 40mins of heating the heat pump starts cycling on/off and as a consequence the last remaining degrees of extra hot water temp increase takes ages & uses disproportionately large amounts of energy
I’m coming to the conclusion that maybe our only sensible option is to stop heating the cylinder at water temp = 45C ( max flow temp on our heat pump is 55C ) and use the immersion heater once a week to raise the tank to 60C
From your experience do you think it’ll be possible to achieve better than 45C water temp ??
I’ve really no idea how the heat pump decides to throttle back, is it dt between in/out flow & therefore possibly we could throttle back water flow rate through the tank coil and present the heat pump with lower temp flow returns due to cold water in the bottom of the tank?? Or is this just rubbish, I’m no heating engineer. FYI the flow out of the heat pump whilst heating water never gets above 50C – but I’ve established it will flow at max 55C by setting the underfloor heat flow target temp to 55
Any guidance would be appreciated, even if it’s next time buy a heat pump good for 60C flow and a tank with a bigger exchange coil
Thanks
Chris
Hello Chris. What model have you got? If its an inverter type, the control is usually the flow temperature. i.e. as your flow reaches 55C, the speed will drop, and if the cylinder is still below its set-point, the heat pump will continue at minimum speed, but stop if the flow exceeds 55C. Varying the flow is unlikely to help much.
Some models go to a lower output in cold weather. Have you noticed if cycling more in summer?
16kW is quite a lot to ‘squeeze’ into a coil, even if a 3.2sqm one. A smaller heat pump will go a bit higher. Anyhow, you may need to do as you say… set it to about 45c, and do a periodic legionella cycle.
The cylinder size won’t makemuch difference.
My graph is a 5kW Ecodan on a 3.2sqm coil, so that would be expected to manage a higher cylinder end temperure
I would appreciate your thoughts on heat pumps feeding into multifunctional tanks that contain a rifle coil for domestic hot water distribution and buffer water for heating.
Hello Andy,
I guess you are talking about the sophisticated cylinders like the Consolar one (the only one I happen to be familiar with). These seem to be very well optimised, and if used as intended, they should be very good. I hope that the design such systems are improving all the time.
In the past, I have come across several combined buffer and DHW cylinder. These can be problematic, and there is a danger of needing to heat water to 50°C and above, all the time. However the underfloor heating could be more efficiently operated with more direct water at a lower temperure.
That said, there seems to be a trend towards operating radiators at warmer temperatures. In-part this could be because some heat pumps are more efficient at producing hotter water.
When I look at a system, I tend to focus on any unnecessary temperure difference between the flow from the heat pump and the water temperature at the radiators or in the floor pipes. Buffer tanks can introduce undesirable temperure differences, and mixing valves will.
Personally, I like to separate the DHW and the floor/radiators. I feel you have less chance of going wrong long term. However, I am aware that those cleverer than I can design optimise cylinders to give the best overall results. Sometimes performance results are similar, but production costs can be reduced. Sorry not to know enough about developments in this area.
Interesting…. well done for trying to get grips with it. I’ll have a better look when I get a bit of time
John, our air source heat pump has now been operational since the spring. I would value your thoughts and feedback on its autumn performance and efficiency: https://youtu.be/Z6Ce4bsxt9g
Additional information and data available here: https://myhomefarm.co.uk/caernarfon-18kw-autumn-air-source-heat-pump-review
We installed an 18kW air source heat pump and would be interested to get your thoughts John.
You can read about our system here: http://myhomefarm.co.uk/moving-from-oil-to-air-source-central-heating
Or, watch our overview video on YouTube: https://youtu.be/P2tnW4rZl68
Interesting … but I dont see how the flow rate can affect the flow temperature. e.g. if you have a radiator, I can see that if the flow is slow, the return pipe wil be cooler, and heat transfer less. Th flow temperure is fixed by the control settings.
OK, so the heat output (kW) from an emitter (radiator or underfloor) relates to the average surface temperature. So, if you want 1kW from a radiator, you could, for example, set it up to run with a flow temp of say 70C and a return of 30C. There is a graduation of temperature over its surface, the average temperature is about 50C. If you were to speed up the flow, you could get 70C in and 50C out, but the radiator is now hotter, so heat output is considerably more – the boiler needs to give out more heat. I am assuming that controls are adjusted to achieve a similar output. e.g. flow at 52.5 and return at 47.5 (dt 5). As I was saying previously, this is far better for a heat pump since the COP would be higher if the flow temperature drops, but not necessarily much improvement for a boiler.
Thinking of the heat pump side, in general, changes in the return will be reflected in the flow temperature.
Good afternoon. My apologies for taking issue with one of your examples – I accept that you are an expert here but, and this may be a function purely of ignorance, I cannot understand your comments in the last of your illustrations.
You say “…. so the flow rate is far too low, as can be seen by the large temperature difference between the flow and return”.
If the plotted value for return was actually the water temperature then surely, if the floor dissipation was low, little energy would be taken from the water and the flow and return temperatures would be close together. In addition, I don’t understand why the heat pump is cycling when operating in underfloor heating mode. Clearly, from the slope of the input water temperature graph, there is substantial energy transfer between the water and the floor. Also, because of the slope of the return flow temperature (if it is the water temperature) the floor is showing some thermal inertia. Something anomalous seems to be happening here; is the heat pump set to operate at different temperatures when in floor heating mode? Is there a separate control system / mixer unit for the floor circulation system?
Finally, look at the water temperatures whn the heat pump stops operating. If the circulation pump also stops running I would expect both temperatures to decay at similar rates if they are measured in similar positions on the pipework. If the pump continues to run I would expect the return temperature to rise as the flow temperature fell followed by a similar decay rate as the floor lost energy to the universe. Neither of these things happen. Is there a thermal buffer store associated with the system?
Thank you in advance for your comments.
Regards Dave Graham
Hello Dave, thanks for you comments. I see where you are coming from. If the flow-rate were constant, then indeed, a high difference (dt) would indicate a high heat transfer. I think it is more useful to consider it the other way around. If the starting point is the heat pump, then once running, it will be delivering say between 5 and 14 kW depending what the sensors are telling it to do. The flow and return temperatures will ‘find their own temperature’, and this is governed by the temperature and thermal capacity of the floor. e.g. the floor ‘keeps the temperature down’, the heat pump keeps putting in say 5kW in my example. After a few minutes the floor must be absorbing about 5kW from the embedded pipes in the
screed and the flow and return balance-out (find their own
temperature). In effect they are being pulled-up, then pulled down as they pass around the whole circuit. Lets say in my example the flow is about 38c and return 22c. That would be a dt of 16. If we speed up the circ pump and double the flow rate, we should approximately halve the dt.
This would result in water at around 34c and 26c (instead of 38c and 22c). Heat pumps are not like boilers, they have a refrigerant boiling or condensing at a specific temperure that changes all the time (just like a boiling kettle is always 100C). So, a heat pump is more energy-efficienct if it ‘sees’ water leaving at 34c rather than at 38c. (my term grossly inefficint is unfair, i should remove the grossly). Re the cycling. What is happening is the flow temperure shoots up, indicating that the flow rate is low (assuming its outputting about 5kW) . If more floor loops were open, then the flow would be better and the flow temperature would be kept down such that the heat pump could dissipate the heat at a nice efficienct low temperure. It would not need to cycle. (it cycles due to the rapidly because it is trying to
maintain a flow temp of 38C). The circuit is very simple. The water either goes to the cylinder or the underfloor, but it looks at different sensors when in either mode. Its ‘tracking’ 60C in cyclinder heating mode, and looks like ‘tracking’ 38C in floor heating mode. The circ pump stops when the heat pump stops. you are right, they would merge (meet in the
middle at around 28-ish) if the circ pump kept going. They would then drop in time. You are seeing pipes with static water cooling down.
Does that make sense? I should really try to explain it better, and choose good examples. It takes quite a while to get ones head around this stuff