Blog

Pressure drops, flow-rates and LENGTH

(Note- if you are reading this.. you might also be interested in my new flow and pressure simulator)

What is the point of having a large diameter pipe run when the fittings on the heat pump are small?

I have heard that statement enough times to make me want to write a blog about it.  

It seems intuitive to think that any bottle neck in a pipe system is the limiting factor for the flowrate. At first thought, it seems like the ‘weakest link’ in the system.  I then started to wonder why this topic is so well understood by electricians and so misunderstood by some plumbers.

I also recall chatting to a Heating College lecturer who said “They have made these training courses so you don’t need to think anymore”. If that is the case no wonder the topic can be perplexing. However, it is far from rocket science.

So a little thinking …

For water to flow through a pipe system, a pressure difference is required. [between (A) and (C)]. This pressure is usually provided by a circulation pump that literally pushes the water through.

The flow-rate depends on two things, 1) the pressure difference between (A) and (C), and 2) the total restriction of the pipe.

Electrical circuits are almost the same.

In electrical terms, we have Voltage (the pressure), current[amps] (the flow-rate), and total resistance[ohms] (the restriction of pipe circuit)

Every electrician knows Ohms law intuitively –

v = i multiplied by     or             volt difference = amps x resistance[ohms].

However, heating does not have a commonly known equivalent
e.g. pressure difference = flow-rate x restriction

The reason why electricians have it so sussed is that they have the tools to know exactly what is going on in every circuit. A volt meter can show the voltages at all points in a circuit. A current clamp can show the amps that are flowing. We can easily know exactly what is going on in any cable.(e.g the voltages at points A,B & C)

Plumbers have no such luxury. We would need tapping ports at various points around a circuit if we want to know pressure differences.  We only know the static pressure at one point, which tells us nothing. Furthermore, we generally have no idea how much is flowing in each individual pipe run. There is also no easy way of measuring the resistance of a pipe system, so there is no easy resistance equivalent for pipes and fittings. All-in-all, the heating engineer is very much in the dark, and would have little idea what the pressure is at point (B).

Now let’s consider a simplified scenario that an electrician might face –

Here we have a PV panel at a long distance from a house. It will make perfect sense to any electrician to have a very thick long cable from (A) to (B), whilst having relatively thin cables at each end. The important requirement here is that the total volt-drop due to total cable resistance is kept low. For every metre of cable, there is a very small volt drop, and all these add together. The calculations can easily show the volt-drop. You can use a cable calculator on-line.

It is the LENGTH here that is the issue. If (A) and (B) are close, that section could be thin, but if the cable is long, it need to be fat. If the cable is very long, it needs to be very fat. However, making the short ends any fatter will make very little difference to the total volt drop.

Back to our water pipes,

The same thing applies. Every metre of pipe causes a pressure drop (when water is flowing), and every metre adds up. Again, it is the LENGTH that is a major issue here. For example, if you have say a 5m length of pipe and you need 1m head of water (0.1 bar) to make a certain flow rate, then you need twice the pressure if you have twice the length. 50M of pipe would need 10m head (1 bar) to give you the same flow rate. However, it you swap that 50m long pipe for one of bigger diameter, you will have far less ‘resistance’ in the pipe. The required flow rate can be achieved with far less pressure.

You can play with an on-line calculator to see what happens with different pipe sizes and lengths. See http://www.pressure-drop.com/Online-Calculator/

It is easy to overlook the pipe LENGTH, this has just as much affect on the flow and pressure drop as the diameter does. This is why a water meter with a very small bore does not affect the flow-rate very much – it is very short. Put 10 water meters in-line, one after another, and you have a big restriction, and a big problem.

So, back to our earlier assertion that any small-bore section of pipe bottleneck is akin to the weakest link;       The bottle-neck principle does not apply here in the same was as it would to traffic on a motorway. If cars acted like water molecules or like electrons, they would push bumper to bumper and shoot through a bottle-neck at extremely high speed!

I have added a page on this topic here http://heatpumps.co.uk/technical/pressure-drops-flow-rates/

An example

To finish, let’s do a little exercise on pipe sizing. Let’s look at a scenario with a 10m (30ft) high header tank is supplying a tap/valve via a large bore pipe. i.e. a good 1 bar pressure supply of water. Let’s consider extending this pipe horizontally and look at what flow-rate will emerge out the end of it. We are assuming 1 bar pressure at the start, and zero bar (atmospheric pressure) at the outlet.

We can firstly consider a 15mm (outside diameter) pipe (the most common pipe size for taps).
One 40m length of this plastic pipe would give us a flow rate of around 8litres/minute (About 2.1 US gallons/min or 1.75 UK gal/min.). This is a typical bath-tap flow rate.

If we use copper instead, the wall-thickness is thinner and internal bore is bigger. We could have well over twice the length of pipe and get a similar flow rate coming out of the end.
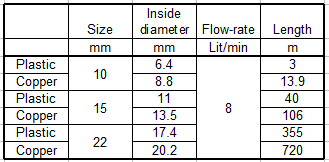
As you can see from the grid, you could go as far as 720m if a 22mm copper pipe were chosen.

If we go in the other direction and fit a small pipe, we can see that a 10mm copper micro-bore pipe that was about 14m long would still give us 8lit/min. If we now look at 10mm plastic with its small internal bore of only 6.6mm (pencils are fatter than that) then it could be no longer than 3m if we want the same flow rate to fill a bath.

This simply illustrates how the diameter and length could be adjusted to give the required flow rate given a certain available pressure.     In summary, a short thin pipe may act similarly to a long fat one.
Selecting the right Heat Meter.

This topic is VERY IMPORTANT
I am aware that the pressure requirements of heat meters is often overlooked – this can be detrimental to a heat pump system.
 
A heat pump will normally be connected to a radiator or underfloor heat-emitter circuit.  A circulation pump (circulator) is required to ‘force’ the water around this circuit.  Each part of the pipework and each components acts as a restriction to flow. The greater the restriction, the bigger the circulation pump needed.  Indeed, many systems have 2 or more circulators, whilst it should be possible to only have one.
Heat meters  (reading heat in Kw’s) are often required to calculate RHI payments. The main component of a heat meter is a device fitted in a pipe to measure the liquid flowrate through the system. This device will cause a restriction to flow. However, it would be ridiculous for our heat-measuring device to impair energy-efficiency by either causing an inadequate liquid flow-rate, or by increasing circulation pump energy demand.
Let us get a ‘feel’ of the pressures involved.   Metres head (height) of water is a good understandable unit of pressure measurement, but several other units are used;
1 bar pressure (about 1 atmosphere)  = 10.2m head of water = 1,000mB = 100kPa
Most common circulation pumps can produce a maximum of 5 or 6 metres water head  (0.5 to 0.6 bar), however, this is at the pump’s low flow-rate.  For energy-efficient operation, we should operate them at mid-pressure range, ideally no more than a pressure of 2.5m head of water to work against.
Some heat pumps have one circulator to circulate through the heat pump and the emitters.  If the heat pump requires say 1m water head for its required flow-rate, and the emitter circuit requires a further 1m head, then the circulation pump needs to exert a total pressure of 2m head. There is little pressure left  to overcome restrictions for a the heat meter, so the heat meter should not be too restrictive.    Even if your system has 2 circulators, the head meter should not cause a significant restriction so you must SELECT THE CORRECT METER.
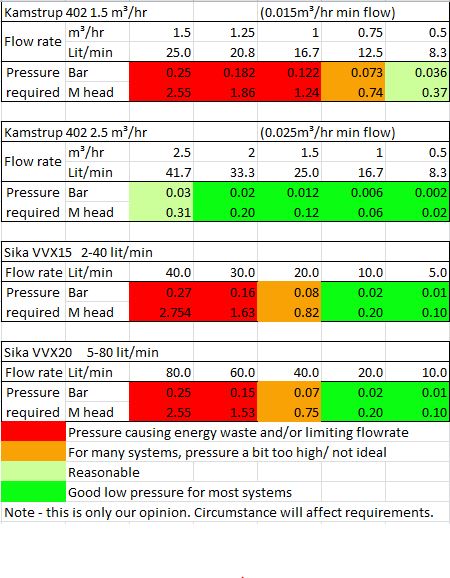
At their rated flow-rate, some  heat meters will require high pressure for circulation.   Some cheaper options can require up to 2.5m head pressure. This is a lot.   However, if a larger heat meter is chosen, its pressure drop can be very low since, for example,  if you halve the flow-rate, you quarter the pressure requirements.   Modern meters can retain high accuracy even at very low flow rates.
E.g. if your system flow is 1 cubic m / hour, your best low-pressure option might be to fit a 2.5 cubic m/hr device.
The example chart  below show how the pressure drop can be very low if the meter is used at a flow-rate well below its maximum.   Note also that some meters are inherently more ‘restrictive’ than others.   The colours are my own opinion, and relate to adding a heat meter to a heat pump system.
The Vortex Flow Sensors have exactly the same issue, and there are fewer pressure ranges to choose from.  However, in the region of 25% of their rated capacity, the pressure drop is usually nice and low.
The message here is – Don’t fit a meter without assessing the pressure drop at your expected flow rate.  Don’t necessarily trust the meter supplier since they don’t all understand the energy loss implications related to heat pumps, and may want to sell you the cheapest option.    It could be perfectly acceptable using a high/medium pressure drop heat meter  on a biomass district heating system feeding radiators, but for heat pump applications, we could be running into trouble unless the pressure drop is low.
Oddly, I see little mention of pressure drop on many heat meter data sheets.


Heat Pump Performance Monitoring Examples

This is an old blog but may be of interest to a few
OpenEnergyMonitor are going strong. See 2020 update here
Summary of a brief presentation at the Ground Source Heat Pump Expo at the Ricoh Arena on the topic ‘Energy or Performance Monitoring’, so its timely to do a little blog here to elaborate on some of the examples I will be showing from some OpenEnergyMonitor dashboards I have been using
Note; The below are just examples for this blog, and don’t necessarily show the whole story.
I have been working with OpenEnergyMonitor for some time, and now have various installs using OEM kit from Megni.co.uk
In brief, most of the systems I have installed use around 8 temperature sensors, CT power measurement with voltage sensing (real power including power factor), and/or pulse counting from standard electrical kWh meter.  I have used Grundfoss VFS flow sensors, but we are currently working on the direct interrogation of a Kamstrup heat meter, giving heat output
Data is sent via Ethernet to www.emoncms.org and displayed on dashboards (as samples below). These real-time graphs give a fantastic tool for the installer and the home owner. They show exactly what is happening now, and what has happened over the previous hour/week/month or year. The information can be used to improve the design of a system and also be used to fine tune the user settings.
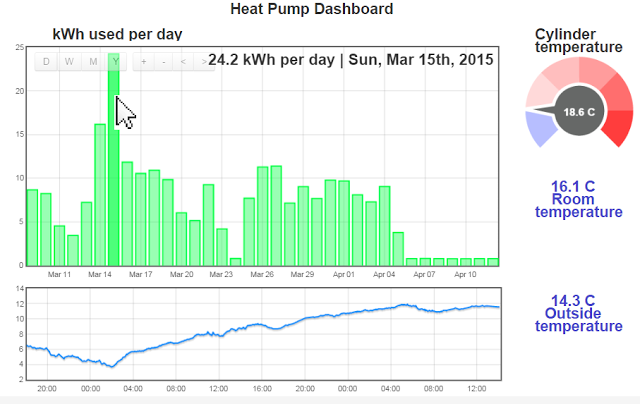
Let’s start with a SIMPLE dashboard example
This type of dashboard can be accessed on any internet-connected computer using www.emoncms.org    e.g.  www.emoncms.org/example
The dashboard above shows a bar graph of daily energy input to the heat pump. This can be checked periodically for unusual values. It is showing high use on 15th March. By mousing-over the graph we can see that on this day, 24.2 kWh were used. The reason for this high use could be investigated.  The time period can easily be changed to anything you wish by zooming in or out.  Below this is the outside temperature. This might be interesting on its own right, but may be interesting if compared to energy used per day.   To the right are a few useful dials and figures –  cylinder temperature, room and outside temperature – things any home owner might like to know.    We can see that as from 6th April, the system is switched off.
This type of simple dashboard is ideal for the home owner, but we can make as many dashboards we like, of varying complexity and detail.  These are very useful for installers and designers, and a far more in depth analysis can be made.
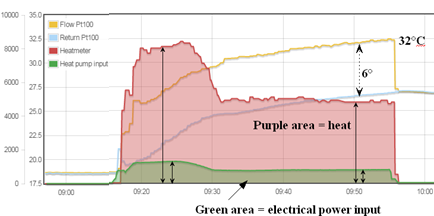
Let’s start with a good example of a GSHP connected to underfloor heating.
This is a 12kW (max output) inverter-drive GSHP operating for a 40 minute period here. The green area represents electrical input and the purple represents heat (direct reading from Kamstrup meter).  The ratio if these two areas gives the COP.  We can see the flow and return temperatures slowly ramping up to a final flow temperature of only 32°C.  Since this is September, the ground collector is exceptionally warm. This, along with the low flow temperature explains why the COP is currently almost 6.  Current conditions are ideal, but from tests earlier in the year, we expect to see average COPs for heating in excess of 4.
This graph is showing us a healthy flow-return dt of 6 degrees.  It is also showing how nicely the speed of the compressor drops in response to the rising flow temperature.
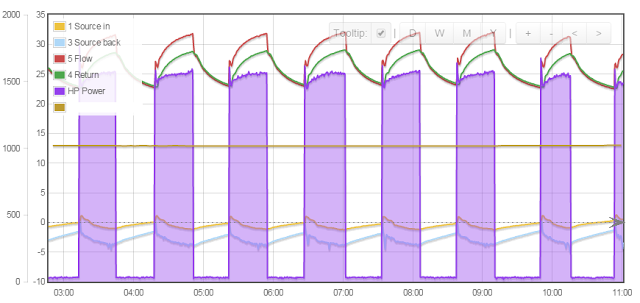
Below is another snip. This time from a fixed-speed GSHP. This one shows the source temperature too.
This shows a period of about 1/3rd of a day, and approx. 30min. run durations which is quite acceptable. The flow and return is nice and low, with average flow temperature around 30C.  The underfloor is a good design here, but he source is dipping below zero. This is not ideal, but a zoom-out of yearly temperatures and knowledge of total heat used would give better understanding.  In this case, since the underfloor is so good, it may be acceptable to have a slightly inferior ground source.
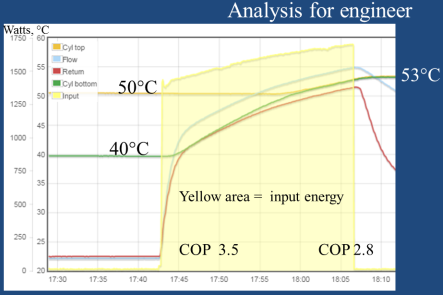
Next, a good example of a GSHP heating a domestic hot water cylinder.  The cylinder is copper with the heat exchanger coil in the bottom section of the cylinder. The heat pump is only 3.5kW and the coil is a nice large 3sq m.
This example is showing the heat pump electrical input power as the shaded yellow area  (no heat meter fitted). The heating period starts at about 1.3kw input and finishes at around 1.7kw.  It also shows four temperatures;  cylinder top and bottom, and the flow and return temperatures.
This graph is showing the early evening heating period having been off by a time clock.
As we can see, the top of the cylinder is still at a useable 50°C before heating, but the bottom has dropped to 40°C.  The 24 minute heating period shown here starts by heating the bottom water from 40°C.  Indeed, this system has been set up carefully to ensure the system heats from a lower starting temperature.  The heat pump ‘sees’ flow and return temperatures of only 45/40°C at the start.  The 40°C cylinder bottom (not very hot) ‘pulls down’ the heat pump working temperatures, resulting in a high energy-efficiency.  By looking up the heat pumps performance data, we can estimate the average COP with reasonable accuracy; here it is about 3.5 at the start of the heating-up cycle.
As the cylinder warms, we can observe the point just before 18:00 where the bottom is becoming warmer than the top, and natural convection causes the top of the cylinder to rise with the bottom. After about 25 mins the whole cylinder has reached about 53°C.  At the end, the heat pump ‘sees’ temperatures of 55/52°C.  This is getting quite hot, and getting close to the limit of the heat pump’s comfort zone. The COP here may be about 2.8.  (taken from heat pump data).  We can then look at the period of time the heat pump has spent at different COPs, and estimate the COP for the whole DHW heating session. Its somewhere around 3.05.
If the system were enabled 24/7, and the sensor position not optimised,  the lower cylinder would not  drop so far, so the cylinder would  heat  more frequently from a higher starting point. The average working temperature would be much higher, so COP would be lower.  At worse, the COP could be not much better than 2.8.  Added to this, losses from the pipe run, and starting-up losses could result in worse performance.
We can therefore use the monitor to enable us to set the system to operate at a low average temperature, but for the cylinder top to remain at a useful temperature (e.g. say 47°C).
We can also see how nice and close the final cylinder temperature (53°C) is to the maximum flow temperature of the heat pump (55°C). This minimises the need for immersion heater (with COP of only 1).  In this case, the compact copper heat exchanger is exceptionally large compared to the heat pump size, and the coil is also only occupying the lower section of the cylinder.  This gives exceptionally good results, and allows us to heat some of the water  in a ‘batch’ from a colder starting point.
For the next example we have a complete contrast. This is a very inefficient system!


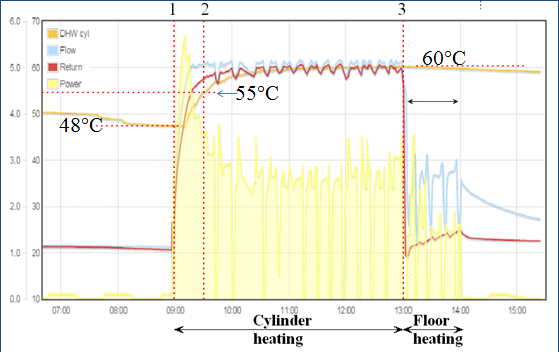
This one is a 14kW  ASHP.  The heat pump is fine, and function exceptionally well,  but the cylinder heat exchanger is debatably a little small for this big heat pump.
Looking at the graph, heating starts when the middle of the cylinder is 48C.  the flow temperature s runs up to 60C within 15mins, at which point, the input power drops and the heat pump ‘tracks’ the 60C flow temperature.  After 30mins running, the cylinder is 55C.  The flow temperature here is considerable higher than our previous example. In part due to the heat pump NOT reducing its speed, and in part due to the smaller heat exchanger coil, but it has not done too bad.
However, the period after 55°C is clearly grossly inefficient.    We can see that the compressor switches off frequently and spends the next 3.5 hrs! attempting to achieve 60°C.  The other thing to mention here is that the distance between the heat pump and cylinder is around 15m. What is actually happening is that most of the heat is simply being lost from the pipe run.  The energy consumed is shown by the yellow area of the power plot.  The final 5 degrees (to 60C) uses several times the power (area) of the first section from 1 to 2.
The biggest problem here is poor use of the controls.Clearly, it would make a lot of sense to adjust the hot water setting to 55°C so that the heat pump stops.  .
The final ‘floor heating’ period is just as terrible as the DHW period. Here, only 1 or 2 underfloor zones are open so the flow rate is far too low, as can be seen by the large temperature difference between the flow and return.  This is in excess of 10 degrees. Again, heat dissipated by the floor is far too small for this large heat pump.
This is a clear case of an over-sized heat pump connected to a cylinder and emitter system. A smaller unit would work far better.
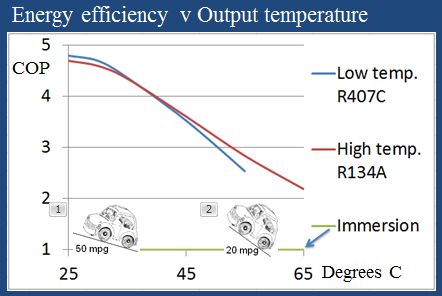
Finally, just to top anyone up with a little heat pump theory, I am adding a graph that I used to illustrate heat pump efficiency v the output temperature.   If there is one thing to learn about heat pumps – LEARN THIS.
Here we have the characteristics of 2 sample heat pumps.  The vertical Y axis shows the efficiency, the COP. A 3kW immersion gives 3 kW of heat. It has a COP of 1. Heat pumps give out more heat than they consume because they extract heat from outside.  The X axis shows operating output temperatures ranging from tepid on the left to very hot on the right.
I am showing 2 typical heat pumps. A typical (R407C refrigerant) unit can reach say 55°C, whilst a ‘high temperature’ (134A refrigerant)  unit may achieve 65°C.  Anyhow whatever type, we can see that to the left, where the water is lukewarm, the heat pump has an easy time, hence the COP is very high (1kw in for 4.5kW of heat). I liken this to driving a car up a slight incline. We should get good fuel economy here, maybe 50mpg .  However, it we heat up to 65°C, the temperature ‘lift’ is great, and this is a little like driving a car up a steep incline – we are in a low gear and the MPG is only 20!.    In the same way that you will NEVER get good fuel economy when driving up a very long steep hill, you will not get a good COP when heating to a high temperature.  That said, it should always be better than using an immersion heater.
So, knowledge of the performance of any heat pump should be understood, and data should be available for all models relating to output temperatures at specific ground source or air-source temperatures.
If you have a high temperature heat pump, it doesn’t mean you always have to operate it at a high temperature.  If you operate it at lower temperatures, the performance should be far better. It is however always a good idea to find out the working limits of you unit.
Some of you may have wondered about the flattening of the curve at very low temperatures.  I have drawn it that way because some heat pumps are not very good at the extremities (limits) of their performance. However, I am finding (and partly guessing) that most inverter heat pumps with electronic expansion valves work very well over a very wide range, so some heat pumps will easily exceed COPs of 5 in ideal conditions (usually late spring or autumn, when not much heating is needed) .Never forget mid-winter conditions – this is the time we need most heat, so the operational area to focus on.


So, it is with an understanding of the characteristics of heat pumps, performance monitoring can be used to great advantage. In general, we want heat pumps to spend as much time at lower output temperatures ( and high source temperatures) as possible.

Temperature sensing with OpenEnergyMonitor

Temperature sensors for monitoring heat pumps


I have been using OpenEnergyMonitor.org energy monitors with heat pumps for a few years now and thought I should briefly share my experience.  This covers the practical side of temperature sensors, and is based on my experience.
(If you just want advice about fitting temperatures sensors onto pipes, skip further down the page)

Introduction
The sensors used in OpenEnergyMonitor.org modules are DS18b20. These are Maxim 1-wire digital sensors.
They actually have 3 connections;   0v, 5v and signal.   Since each sensor has its own unique i.d. code, multiple sensors are simply connected into the same 3 terminals on the monitor device.
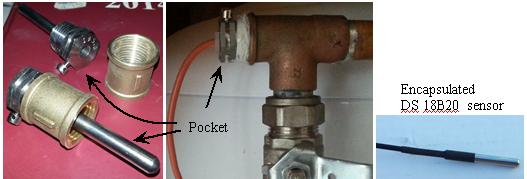
They are mostly bought ‘encapsulated’ in a shiny stainless sensor end all ready with a cable.
The great advantage of these digital sensors is that there are no errors due to cabling.  Phone extension cable can be good enough.  Thermistor sensors (variable resistance, as PT100) rely on a specific cable resistance and furthermore some sensors could ‘drift’ out of calibration.   A further advantage of digital sensors is that they do not in themselves generate heat. They can therefore be used in still air with good accuracy.

If several sensors are strapped together (with an elastic band) and tested in a thermos flask over a few hours, most seem to read within 0.2 degrees C of each other.  If you have say 6 sensors, you can chose those that agree most for the most important sensing (e.g. flow and return).   Anyhow, these sensors are perfectly accurate enough for this type of monitoring, and there is comfort in knowing that if you are seeing 35.2C (for example) on a graph, then that sensor tip must be at 35.2 +/-, with a small error margin of say 0.15 degrees.  This is because the digital signal is generated inside the sensor.

What to measure on a heat pump?

Typical temperature measurement could include the following:
Ground source
Water flow and water return from heat pump (hot side)
Ground collector glycol  inlet and outlet from heat pump (cold side)
Outside (ambient) air temperature.
Hot water cylinder temperature, and at least one room temperature.
Air source
Water flow and water return from heat pump (hot side)
Outside (ambient) air temperature and air-off (cooled air leaving heat pump)
Hot water cylinder temperature, and at least one room temperature.
For either of the above there could be a buffer cylinder involved in the design, therefore the flow and return from buffer cylinder to emitter (e.g. underfloor or radiators) may need to be monitored.
There may also be mixing valves (sometimes unnecessary mixing valves) on underfloor manifolds. These may also need monitoring.

For more detailed analysis, the refrigerant internals of the heat pump can be monitored. These may include discharge, suction and liquid temperatures.   This is however a little intrusive, and could affect the warranty. It may be necessary to discuss this with the system installers.

Measuring air and liquids 

Air

Measuring internal air temperature is relatively straight forward, but sensors must be positioned away from any source of heat or radiation source.  Sunlight and close-by appliances and even lighting can greatly affect readings.
The general rule for outside air measurement is to keep the sensor well away from sunshine, or areas that get sunshine.  The sensor can also drop below the air temperature if it can ‘see’ a clear sky.  A small polystyrene roof is a good shield protection from positive or ‘negative’ radiation (i.e. when radiation from sensor is greater than its surroundings).  It is also necessary to keep the sensor dry, unless you purposefully wish to cover it with a wet ‘sock’ to record Wet Bulb Temperature.  There is a lot of information available about this relating to weather stations.


Liquids

Most heat pump monitoring involves the temperature measurement of water and liquids flowing in the pipes.
For very high accuracy results, as required by heat meter devices, an immersion pocket is required. (Heat Meters measure the difference between two sensors, so both must be very accurate)
The pocket usually involves a ‘tee’ fitting and a hollow pocket that is completely surrounded by the liquid. The sensor is inserted into the pocket.
 
An easier and cheaper method is to fix the sensor to the outside of a metal pipe. This method is used in all heat pumps for their on-board sensing.
Any sensor that is outside the liquid can be affected by the temperature of the surrounding air, but the error in the reading can be negligible if the sensor is mounted correctly.

There are various methods as follows-

1)  Sensor strapped to metal pipe or metal fitting
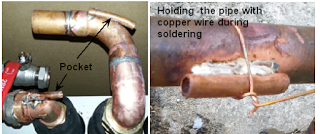
2) Sensor inserted in surface pocket (a pipe soldered to the pipe’s surface)

This shows 10mm pipes that have been soft-soldered to copper fittings. Due to the high conductivity of copper, the temperature of the inside of the small pipe is almost exactly the same as the temperature of the liquid inside the pipe. After insulating (lagging) this pipe, the accuracy of the sensor inserted inside the small pipe should be excellent.  Ideally the pocket internal diameter is close to the sensor diameter.  Conductive paste should be used before inserting the sensor
It is a good idea to fit several pockets like this in the right places during installation. Obviously the pipe must be empty.
Many heat pump manufacturers solder pipes on the outside of water or refrigerant pipes so that their sensor probes can easily be inserted to give accurate measurement


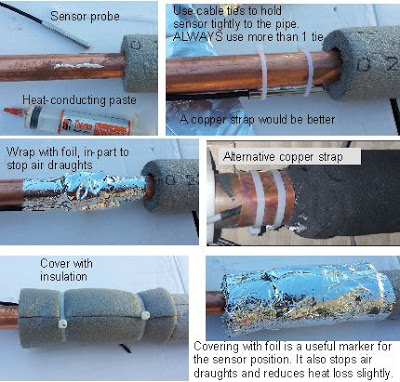
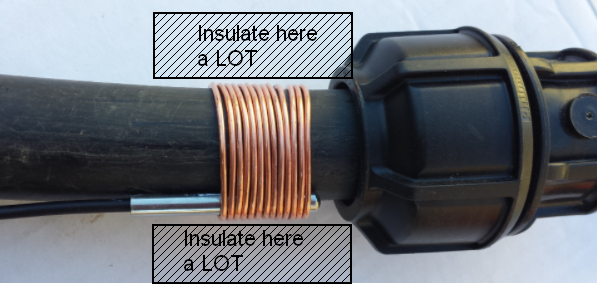
Strapping a sensor to a pipe (or a pipe fitting)Whilst not as good as surrounding the sensor with a conductive copper pocket, it is possible to simply strap the sensor to a pipe.   Strapping using a copper strap (as used in refrigeration) , or copper wire, will give better results.
The following shows one simple method.


Copper or brass conduct heat well.  The temperature difference between the inside of the pipe and the outside is tiny, so always fit sensors onto metals.  Plastic pipes are poor thermal conductors, so the effect of surrounding air can affect the sensor temperature. Furthermore, if the pipe is changing in temperature, the sensor may ‘lag’ in time behind. i.e. it will respond very slowly to temperature changes.  This may or may not be a problem.
This is not the best position for a sensor since there is 3mm of plastic between the liquid inside and the probe, however, the copper wire strap is making the best of a bad job.  Heat will conduct along the copper. There is a lot of copper in contact with the plastic, and this will conduct and will transfer heat to/from the ‘surrounded’ probe.  If this is insulated well on the outside, it may give good-enough results for ground source comparisons.  Time response may be a little slow, which may not necessarily bad.   Fitting the probe onto a metal fitting is a far far better bet.

Getting the best from underfloor heating

[Note, this blog was published 2014.. the underfloor heating industry has developed a lot in the last 5 years]

Many years ago, when heat pumps were not so common, I found it a real struggle to get any of the main underfloor heating suppliers to embrace the need for low water temperatures for use with heat pumps.

15 years on, and I’m sure that things have changed dramatically, but I’m still stumbling across things that make me doubt that.
When I visited Germany over 10 years ago, I got the feeling they commonly use much closer spacing between floor pipes than we do in the UK, and I have read of very close spacing (50mm) in Austria.  I realise these are potentially cold countries, but even recently visiting a Spanish heat pump company, they were surprised that we don’t use closer pipe spacing (more pipes).

Over the last 6 months I have heard several references in the trade to; ‘never use closer than 150mm pipe spacing’.   However, CIBSE clearly give ratings for 100mm spacing, as does the MCS Emitter Guide, so why are some in the UK so resistant to putting more pipe into floors.
To basics     COP v heat pump water temperature
Heat pumps are more energy-efficient if the water temperature is low.
Coefficient of performance (COP) = heat output / electrical power input
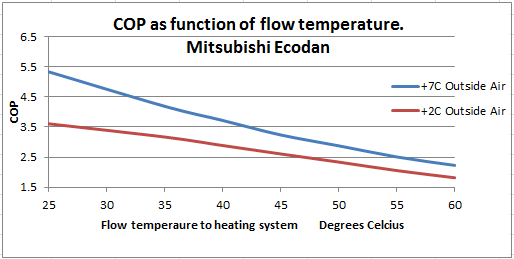
This graph of an air source heat pump shows how beneficial a low flow temperature is.   Units like this with electronic expansion valves are particularly efficient at very low water temperatures.
How to get a low flow temperature with underfloor heating
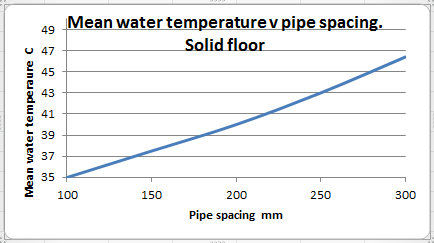
The values for the example graph above have been extracted from CIBSE, and show a general trend for a fixed heat output.  It demonstrates what we all should know  – the closer the spacing, the lower the required water temperature for the same heat output.
Putting the two together we could plot pipe spacing v COP.  It would clearly indicate that closer spacing improves COP, so why do some seem reticent to embrace close spacing?  Is that added cost for more pipe really that much??
I have gleaned that some people have the notion that close spacing could lead to warm floors and an overly hot house.  The whole point here is that with closer spacing, we can turn the water temperature setting (heating curve) down, and get the same heat output, thus improving the COP.
I think some of the fears about hot  floors stem from boiler systems, many of which had plenty of extra output capacity for quick warm-up, and hot patches could result. However, heat pumps are generally slower response, with lower water temperatures, so are much more forgiving in this respect.  I recently visited a system where I had used 50mm spacing in an always-open loop in a bathroom.  I asked the owner if they had ever thought the bathroom floor was too warm.  The answer was no, never. 
The reason why I had used 50mm spacing was that we didn’t want a buffer cylinder, so I was trying to ensure there was adequate water quantity, and flow-rate in the floor – effectively using the floor as a buffer.  
Another hot (excuse the pun) topic here is floor coverings. People are now seeing that a carpet will drop the star rating for RHI, so there is an added financial incentive for having solid (tiled etc.) floor, as seems far more common in Germany, instead of carpet.
However, by designing a house where some rooms are tiled, and some are carpet, you are somewhat limiting any changes that future occupants might wish.  (e.g.  if 100mm spacing in a carpeted room, and 200mm in a tiled room).   Underfloor pipes are literally set in stone, so can never be changed.  The only solution that I could think of here would be to interlace the loops (given that there is often more than 1 loop per room).  There is always the option of turning off one of the interlaced loops.  I like multiple interlaced loops.
I have come across an installation where a new owner had fitted thick pile carpet in one room without thinking the affect it would have.  The result was a cold room, remedied only by turning up the water temperature, thus  increasing the running cost, and the reliance on room thermostats to limit heat to the tiled rooms.  
The general design approach for underfloor is to consider the heat required (e.g. watts/sq m) , but unless a buffer cylinder is fitted, we should also consider what heat is being delivered to the floor, given that some zones will be closed for some of the time, and the outside temperature is seldom at design temperature (-2C etc.).   For most of the time, we have far more available heat than the floor needs.  Even with modulating heat pumps, there can still be a tendency for the flow temperature to stray above the theoretical flow/return temperatures. This is another reason for favouring more pipe in the floor.  Furthermore,  MCS requires the heat pump to provide at least 100% of the design at -2C etc.  Due to models only being available in certain size jumps, the heat pump installed is often oversized, so this is an added reason for ensuring that there is adequate pipe in the floor.
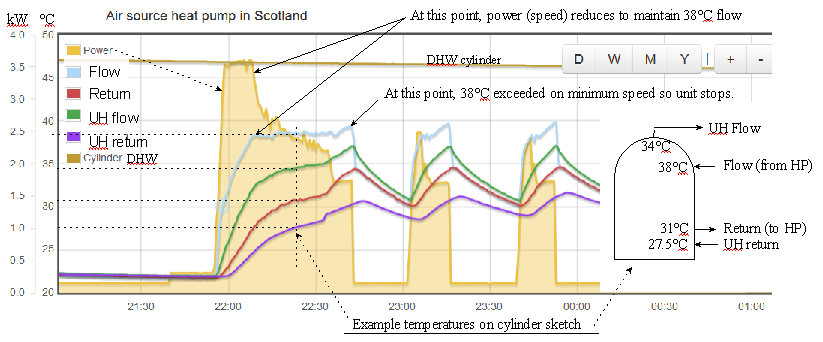
For any thinking that buffer cylinders are the perfect answer – they may be an answer, but they are seldom perfect, as shown by this piece of monitoring.     (openenergymonitor.org)
In this example of a system with a simple buffer tank, the heat pump flow/return needs to be approx. 4 degrees hotter than UH flow/return.    This could reduce energy efficiency by 10%, plus the added energy to run a second circulation pump.
A buffer can usually be avoided IF enough zones are always on AND if there is plenty of pipe in the screed.
Another potential worry is the thermal mass of the screed.   I was recently involved in the design of a passive house where a buffer cylinder was not wanted, so I proposed  to use the screed as the buffer, and fitted 9 x 100m loops with average 100mm spacing in a  floor that was 200mm thick.  One might expect some temperature overshoot, and I may not have been so bold as to propose it if it were not for the fact that due to the interlaced nature of pipework,  we could shut off ½ the zones if we needed to.
The result was surprisingly good with all room zones open and control on one master thermostat. The whole house has very even temperatures.  This demonstrates the self-regulating nature of very low temperature underfloor heating.
Another concern I have heard of is the pumping power required  for such a lot of pipe.  In the above passive house example.  If the heat pump needs 10 lit/min to give a 5 degree flow-return dt , then the flow rate is about 1.11 litres/min for each pipe loop.  If we used a more standard 5 loops, the flow rate per loop would be 2 litres/ min.  For the same heat (kW) and same dt, more pipe actually means less pumping power since the heat output per m of pipe is lower, and the flow-rate for each loop  is lower.
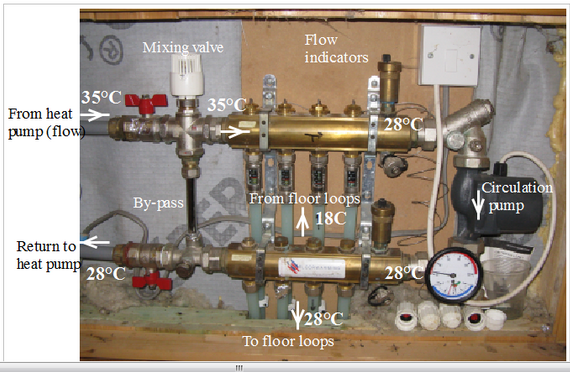
Finally, I have also come across the notion that mixer valves and pumps are desirable, even for a heat pump. Generally, mixing valves hinder energy-efficiency.  Here is an example to illustrate the potential penalty of having a mixer even if the mixer never actually mixes (i.e. its fully open).
The arrangement here with recorded temperatures shows that the flow to the floor is always equal in temperature to the return to the heat pump. In this example, the flow from the heat pump is 7 degrees higher  than the flow to the floor.  The mean floor temperature  was only 23°C (average of 28 & 18).
If the mixing valve and pump were removed, the heat pump’s flow could go directly to the bottom manifold.  
To get the same floor heat output, the heat pump setting could be adjusted down so as to give a working flow of 26 and return of 20.  This is a reduction in flow temperature of 9 degrees, potentially (according to our first graph at top of page ) saving 13%.  
(see top graph – The COP at 35°C is 3.1, at 26C its 3.1, saving 13% in COP). 
All these little details can eat into potential savings. They should be dealt with at design stage.

Potential perils of plastic pipe

(Note, if you are reading this you might also be interested in my flow/pressure simulator)

A college tutor recently suggested to me that the current environment in the heating industry does not encourage analytical thinking.   Maybe I should therefore be less amazed when I come across plumbers who think copper and plastic pipe are interchangeable.

Before you think I am anti-plastic pipe… I am not. The right size plastic is absolutely fine.
Environmental considerations of the materal aside, a more direct issue is that of flow rate and pressure drops.  Bore size of plastic is considerably smaller than copper, and it seems that this is often overlooked.  If installers select plastic pipe instead of copper without checking the size correctly, this could have a negative effect on heat pump’s performance.
(If you drop-off to sleep ½ way through this – read the scenario at the end )
With respect to the materials of plastic and copper, it would appear that the total energy involved in mining and manufacturing copper is far greater than the total energy (including the crude oil to make the plastic) to manufacture plastic pipe.  Here is one site that discusses the topic  , though not necessarily without bias.
Another factor to consider, that mainly affects pipe runs to hot taps etc, is the heat capacity of the pipe material. Plastic has a relatively high specific heat, and the wall is thicker, but it’s light. The net thermal capacity of the two is fairly similar.
(The cold feel of copper is more to do with conductivity from the hand than heat capacity)
However, obvious factors aside, one of the biggest issues that could affect installations involving heat pumps relates to the internal bore diameter.  This could have a very noticeable effect on the energy-efficiency of the system.
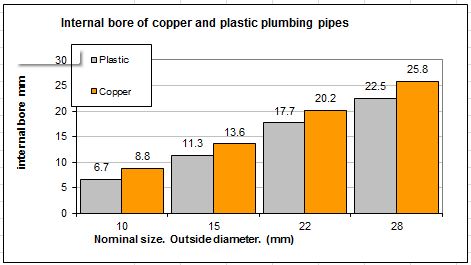
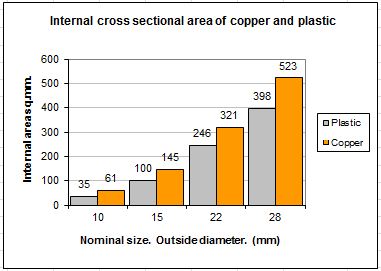
All metric pipes are measured by their outside diameter. As can be seen, with common pipe sizes (outside diameters), equivalent plastic pipes have considerably smaller internal area to copper. This has a dramatic effect on flow characteristics.
 The graphs below illustrate examples of the relative internal dimensions of common pipes.
 
A brief note about smoothness – It seems a common belief that plastic is ‘smoother’ than copper, but the inner wall ‘smoothness’ of the two is about the same.  However, plastic can be one-piece with slow sweep bends. In a different sense of the word, this is certainly ‘smoother’ than copper with tight elbows.   Re inner surface, we can assume the two materials are about the same.
Whilst it is fairly easy to look-up the pressure drop resulting from a specific flow rate with a specific pipe, we can see from the 2nd graph at-a-glance the relative flow capacity since the cross sectional area loosely indicates flow capacity.
If a certain flow rate is required, then we can look-up the required pressure that is required across the pipe length (beginning of pipe to end of pipe length).  The internal bore must be chosen such that the circulation pump is not overly large and energy-wasteful.
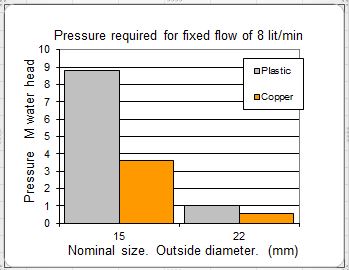
This graph shows the approximate pressure required to maintain a certain flow rate for one specific fixed length of pipe example.  As can be seen, the pressure drop along the example pipe varies very dramatically, so the wall thickness makes very big difference. 
In this example, we can see that a 15mm copper pipe could be used with a common central heating pump (shown at 3.6m head, 36kPa). However, if plastic were chosen, then one would need almost 9m head to achieve the required flow – far beyond the capability of normal circulators. On the other hand, if 22mm plastic were chosen, the pressure requirements would be only 1m head (10kPa) which is likely to achieve very low circulation pump energy.
In real life, we tend to have a pump connected to a pipe system, and the flow rate that results is dictate by the balance between the pressure produced by the pump and the ‘restriction’ of the entire pipe work circuit.
There is a common concern about the restriction caused by the inserts (stiffeners) needed at joints. These restrict the bore, but they are so short that the the affect on flow is much less than it may seem.
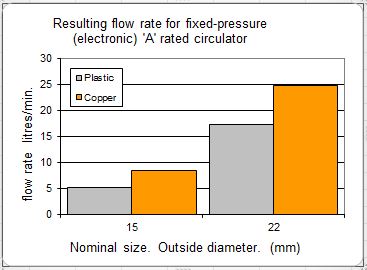
For our final graph, we consider a pipe circulating with a fixed-pressure electronic pump (Alpha etc)
The above graphs show relative changes in flow rate that would result from a fixed pressure. If the pipe chosen were too small, then a larger circulation pump may be needed in an attempt to compensate for the extra restriction caused by the small internal bore.
The point here is that by choosing plastic instead of copper of the same nominal size, the system could potentially suffer unless the sizing is checked. There is of course no problem using plastic if it’s the right diameter.  Indeed, 28mm plastic may be an ideal choice for the connections from a heat pump simply to minimise noise transmission.  The best final solution is often a mixture of both plastic and copper for a multitude of reasons.
All this emphasises how dramatically the wall-thickness affects flow rates and pump pressure requirements, but how does this translate into reduced COPs?
Scenario(based on something I observed on a barn conversion)
Let us consider a radiator at a far distance from the heat pump.  The flow-rate relates to the pressure drop, which relates directly to the pipe-run length, and of course, the required flow-rate relates to the room size (bigger the heat demand, the more flow required).  In this instance the room is large.
The default pipe size choice would be normal 15mm (outside diameter), but if the sums are done, it may become apparent that the choice should be between either 15mm copper or 22mm plastic. 
How could a pipe with too small bore affect the COP? 
Radiators should be balanced, in general by throttling valves (lockshield)  on smaller radiators, and those with shorter pipe runs. However, this is actually quite a difficult thing to achieve with a heat pump because the temperature difference (water inlet to water outlet) may only be 5 degrees (°C).  (It’s much easier to measure and adjust when the temperature differences are larger).
It is not ideal, or easy, to have to throttle most other radiators on a system, and there is the added risk of the circulation pump not being big enough to cope.
The likely result of any ‘restrictive’ pipe-runs would be a reduced flow rate to the radiator.  This would result in a considerable area (the bottom) of the radiator being cool, and a reduced heat output to that room.
The obvious action to redress the short-fall of heat would be to increase the flow temperature by increasing the heating curve setting of the heat pump. i.e. increasing the flow temperate from say 40 to 45°C.    Now the heat pump has to heat ALL water to a 5 degrees higher level.  This is likely to reduce the COP by 10 to 12%.

This all indicates that one must never assume copper and plastic are interchangeable without considering the pressure drops and diameters.  That aside, we have also highlighted the importance radiator balancing.  Ideally the pipe runs to radiators would be laid out, and bore sizes chosen so that the flow rates are naturally about right without the need for much valve adjustment.  A little extra work on the design makes life much easier thereafter.

Anyone intersted in further reading on water flows – this site is very interesting
http://www.johnhearfield.com/Water/Water_in_pipes.htm

Here you can enter pipe sizes and find out the pressure requirements to achieve a certain flow rates.   And here

Stand-by power and air-source heat pumps

 I have been aware for some time that my 5kW air-source heat pump (ASHP) has been using about 3/4 of a kWh/day whilst doing ‘nothing’ over the summer (no circulation pumps running), but recently I have put energy monitors on other ASHPs and was shocked see that these known-brand units are using 2kWh/day when doing no heating at all – I bet the average family use less than that showering! (an 8kW shower for 15 mins = 2kWh).
 
Whilst in standby mode, is there any reason or excuse for it consuming so much? I think not.
There has, in recent years, been a general focus on standby power since this ‘constantly dripping tap’ can tot-up to a sizeable amount. Highlighting this problem has been very productive – the standby power of most new products has now plummeted.
 
Let us look at some figures to get a handle on the quantities. Here is what I recorded using pulses monitored from my kWh meter
ASHP on standby          31 watts (average),       0.75kWh/day,     272kWh/ year,      (£38 / year)
My A++ larder fridge   7.6 watts (average),     0.182kWh/day,        67kWh/year,      (£9.30/year)
 
Yes you have that right – my fridge, in use, used one quarter the power of the heat pump on standby!
 
Standby power is however quite hard to measure accurately using any instantaneous devices. This is in part because the current (amps) wave form from modern electronic devices bears no resemblance to a sine wave, and in part since the values are relatively small . For my own satisfaction, so I borrowed a calibration unit to verify the accuracy of the ‘real power’ OpenEnergyMonitor internet-connected devices that I am also using. http://openenergymonitor.org
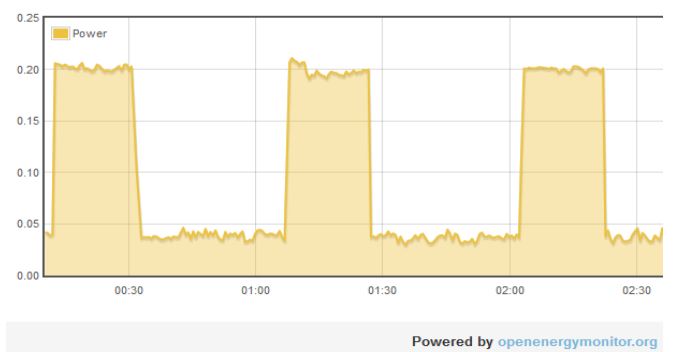
Here is a plot of the 9kW ASHP that is consuming 2 kWh per day (Y axis is in kW).
It alternates between about 35-40 watts and 200 watts.
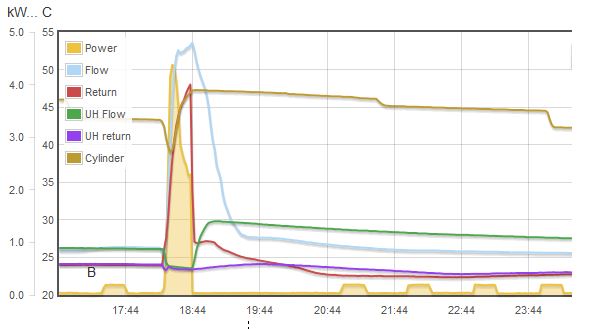
 Below is a plot that shows an 8 hr period..  Scale is 0 to 5kW input power.
The buff-coloured area on this 8hr plot relates to energy use, and shows a hot-water cylinder heating ‘hump’ (above 18:44) . This illustrates at-a-glance that the buff-colour area of the standby ‘blips’ (on the bottom axis) forms a significant chunk of the total.
 
I have previously decried ground source units with controllers that use 15 watts, so why are these particular air-source heat pumps using so much?
 
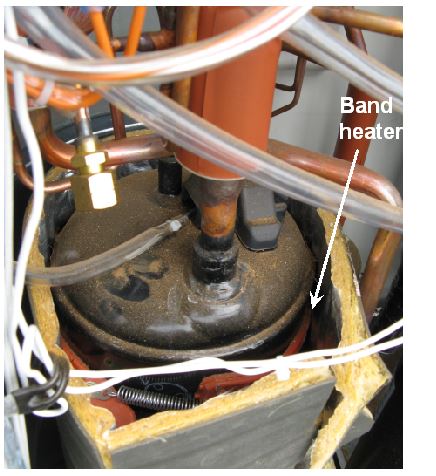
The oil inside the compressor can absorb some of the refrigerant. This not only thins the oil, but it can cause oil-foaming at certain times – both can lead to bearing failure due to inadequate lubrication. One answer is to keep the oil warm, and a small electric compressor heater (crankcase heater) can be used for this purpose.
 
Ground source units are situated indoors, so usually stay relatively warm. I don’t know of any GSHP with a compressor heater. However, air-source are sited outside, and they can experience extreme ‘swings’ of temperature. The worse scenario would be a cold sub-zero night followed by a warm day. In this scenario, the lightweight heat-exchangers warm up, but the heavy compressor can remain the coldest part of the system. Some refrigerant can then migrate to the coldest part (in effect, it condenses in the compressor like water condenses on cold windows). If this cold refrigerant-laden compressor were to start, then there is risk of damage.
 
The picture shows the compressor with strap-around element heaters. The compressor was quite warm, but one wonders why the lagging around the shell was open at the top; possibly to aid compressor cooling for times when the compressor is working at it’s upper temperature limits?


What is the solution?
 
There is a lot of scope here.
 
Most of these Japanese-type heat pumps are very impressive, they are clearly very well developed and very reliable. Computer-aided fan and heat-exchanger design has led to highly efficient quiet products, and most defrost mechanisms are very well optimised, but are all aspects up to scratch?
 
It seems already (from graph) that the heater is pulsed, and not simply left on, so why cannot a little more intelligence be added to the controller so that the switching can be controlled more responsibly.
 
Lagging the compressor should also be possible, and should help, but now one might need to introduce some form of cooling to deal with overheating whist running. There are many options here, and it would take time for a designer to work out the best reliable and cost-effective option that did not compromise over all energy use. I have certainly spent many hours in the past designing crankcase heaters out of systems. The phrase ‘could do better’ springs to mind, and this sentiment should really be directed to the manufacturer’s design office.
 
A similar situation existed with washing machines many years ago. All for the sake of a thermostat, the hot water feed was blended with cold, just in case the hot feed happened to be at 70C , and could therefore potentially damage clothing. No manufacturer wanted to be blamed for harming any clothes so they all played-safe and kept it simple, to the detriment of energy-efficiency.
 
My feeling is that we are at the same point with some aspects of ASHPs. Whilst standby power is a small fraction of the total annual consumption, it is still a detail worthy of attention since I’m sure it could easily be improved significantly.
 
I can think of a simple solution. Make it mandatory to print the standby power on the product label. This would push the manufacturers to give it a little more attention, and sooner or later this unnecessary waste would disappear.


Legionella protection and energy

Legionella protection and energy demand
It is poignant that I write this whilst a hot debate continues in Doha, Qatar over the issue of climate change, which is more evident in some poorer parts of the world, and the proposal that the energy-guzzling West should compensate in some way. This seems to put my blog below into perspective.
I recently read the following on a brochure from a mixing valve manufacturer:
‘The hot water storage tank must be kept at a temperature of 65°C (149°F) or higher in order to control any growth of legionella bacteria’.
I don’t believe this is correct, nonetheless, there seems to be a growing general feeling that cylinders should be kept hotter and hotter.
The desirable temperature to ensure that hot water is ‘safe’, is debatable, and last week’s request from MCS for evidence on the topic confirms (I am pleased to hear) that the jury is still out.
http://www.microgenerationcertification.org/about-us/news-and-events/94-bacterial-growth-in-stored-hot-water-systems
My concern here is the energy required to achieve elevated temperatures. If this is achieved using a conventional boiler system, the extra energy required may not be excessive. However, for a heat pump it is a different matter since the COP varies dramatically as temperatures rise, and I’m not sure that everyone is aware how great the change is.
The concept of periodic pasturisation is a well established method, but the necessary frequency: daily, weekly or monthly, still seems debatable.
Let’s look at the energy efficiency relating to cylinder temperature. For a ‘high temperature’ model,(e.g. refrigerant 134A), and if a heat pump were to heat a cylinder to 50°C (122°F) with a COP of say about 2.3 (assuming evaporating at 0°C, 32F), then the energy-penalty for increasing the store temperature above 50°C for a typical heat pump, as shown by the blue line, could be 11%, 21% and 29% for store temperatures of 55,60 and 65°C respectively. (131,140 and 149°F)
(scroll compressor data including a pump load etc. Evaporating at zero C)
The blue line is bad enough, but for the conventional heat pump model (crimson), with an upper temperature limit of say around 55°C, 131°F, (heat pump water), then the resulting drop in energy-efficiency is significantly worse with elevated store temperatures, since some of the hot water will need to be delivered from an immersion heater, with a COP of only 1. If 65°C were really needed, then even a conservative estimation would halve the COP, and this is on top of the increased energy loss from the hotter cylinder (and pipes) of a hotter cylinder. All in all, the energy implication for heat pumps to comply with over stringent legionella protection could be very considerable.
I am of course being general here, and one could create quite a big spreadsheet attempting to ‘model’ this since there are many variables, and the percentage provided by heat pump/immersion will be affected by things like sensor height, time clock, quantity consumed and various other variables. I am mostly ignoring options of pre-heating or batch heating the water since not much of the installed ‘kit’ does this, but it can be achieved, in part, by the owner’s careful use of a time clock. There is a lot of scope to optimise the net COP here, and a lot to lose as the store temperature rises.
The current new-build requirement for mixing (safety) valves is a bit of a can-of-worms since some valves give a considerable and unnecessary ‘leak past’ of cold water. This forces cylinders to be maintained at unnecessarily high temperatures. Given the 2% drop in COP per degree rise, this tortures any heat pump involved.
Its worth noting here that it was not that many years back that at least one major German heat pump manufacturer suggested storing at 45°C (with occasional pasturisation).
I am yet to be convinced that the legionella risk is as high as it seems to be popularly cited.
Out of the countries millions of cylinders, I’m sure that a small (but significant) number of them are kept at a very low ‘frugal’ temperature. Furthermore, houses are commonly left empty, and cylinders could sit for extended periods with tepid water in them, and are not necessarily sterilised before use. Hosepipes sit out on warm summer days with water in them for for weeks. Car wiper bottles have had warm water in them since the 1960s, and I see no evidence for any significant numbers of serious legionella cases. Am I wrong? For large cooling towers, where warm water is sprayed into air it’s tragically a different matter.
A couple of anomalies strike me. Why is little attention given to open header tanks in lofts (a UK habit) these open-top tanks (hopefully with cover) sit in warm lofts in summer. One might expect that if a cylinder is fed from one of these, it might requre a different steralisation regime to a mains fed cylinder, and surely there should be at least as much concern from the loft tank that there should be from the hot cylinder kept at only 50°C for example.
Of course, this is a very emotive subject. Who would dare to suggest we should ‘ease off’ when life it potentially at stake. On the other hand, is it too radical to consider that the added energy needed for hotter cylinder temperatures could have a wider environmental impact. I see no evidence of DECC or anyone else attempting to quantify the extra energy required. I for one think it is relevant.
I’m not suggesting to take a slack attitude to the problem, but I don’t agree with the a broad-brush turn-up-the-thermostat approach given the energy penalty involved.
It’s quite a difficult balancing act. One has to weigh-up local health and safety with energy costs and CO2. If we debated this at Qatar, and considered the global health and safety, I’m sure that the line would be drawn in a different place.

Underfloor heating in bathrooms (from 2012)

A bathroom has a higher room temperature requirement, so heat requirements are generally higher, but the floor area available for underfloor heating is reduced due to the area taken up by the bath. I have recently come across a few instances of inadequate heating issues in bathrooms – not surprising. The point of this blog is to discuss the option of continuing the underfloor heating to the floor below the bath. This practice seems to be a no-no, and I’m reticent to suggest it’s a sensible approach. If the floor under the bath has wet underfloor heating, the space under the bath will be warmed, this will add heat to the room by a certain amount simply due to a slightly warmed bath and side-panel surface, and clearly a metal bath would be considerably better here than a plastic one. A roll-top, claw-foot bath even better! I have no idea if the quantity of heat is worthwhile. i.e. if the room temperature in the bathroom would be elevated by a worthwhile amount without the need to increase the underfloor water temperature (Very important when a heat pump is used). Many years ago I took a coil of micro-bore pipe, and wrapped it around the outside of my new plastic bath, and ‘bonded’ it with fibreglass. In this case, I was experimenting to see if the bath could became useful radiator area, and if the bath should stay warm whilst in use. The results seemed worse that expected, and no doubt there was little gain for a lot of effort. Given that bathroom loops are generally some of the shortest loops in the system, it strikes me that putting extra pipe below the bath would be easy, and advantageous. Is it the risk of drilling into a pipe when making a bath fixing? Is it the fear that the under-bath could overheat? Is it a daft idea with little benefit? I suppose I should lay an electric blanket under a bath and monitor some temperatures in various places to see how it performs.

Repairing a heat pump – How well is it carried out?


This post is a little specific, and discusses the need for care and consideration when carying out any ‘major surgury’ on a heat pump.  A little extra time setting the system up right will save considerable energy (and money) over its life.

A domestic fridge will generally complete its useful life without encountering any problems within its inner workings (the refrigeration circuit).  A refrigerant leak is almost unheard of.

Ground and air-source heat pumps should also be able to claim such a high accolade, however, due to their added sophistication, component failures can happen, but they are rare.
I was involved very recently with a system where a high-pressure sensor had ruptured. This caused a partial loss of refrigerant and resulted in a breakdown in the form of a low-pressure lock-out.
Heat pumps (and fridges) hold a specific quantity of refrigerant (the heat-transfer working fluid).  This is accurately weighed-in during manufacture, and thanks to good quality-control and all-welded joints, this weight should remain within the system throughout its working life.  Any weight over or under the required amount can cause a reduction in energy-efficiency.
Refrigeration equipment is slightly different to a package heat pump. In the past equipment had many mechanical joints and couplings – potential sources for leaks, big or small. Topping-up of refrigerant was expected, and the norm, after several years.  Due to their design, refrigeration systems are generally less critical of refrigerant quantity – they have a ‘liquid receiver’ (a liquid storage vessel), and are generally topped-up until the sight-glass is clear of bubbles.
(Note:- since there is both liquid and vapour in the system, pressure cannot be used to gauge the quantity)
On occasions when I have advised someone to engage a local refrigeration engineer to carry out a major repairs to a heat pump, I always say “make sure that they weigh-in the correct amount, as printed on the manufacturer’s label”.   Recently, an engineer replacing the pressure transducer ignored this advice and simply topped-up until the sight-glass inside the heat pump was ‘clear’.
The dilemma he could have had may relate to the time it would take to recover and evacuate what was currently in the system before weighing-in the correct amount. There is also a risk of contamination during recovery process. It gets even more complicated since the components of refrigeration blends (as per most current refrigerants; R407C & R410A) can leak at different rates, therefore the final percentage blend-mix of anything either left-in (or recovered) can be incorrect.
The point that I am angling around to here is that the mind-set required to carry out heat pump repairs is different to that required for refrigeration repairs – for the following reasons:
·        The energy-efficiency of a heat pump is paramount.
·        Any refrigerant added may be ‘sealed-in’ for up to 20 years, so ensuring that it’s ‘right’ (for highest energy-efficiency) is essential.
·        The refrigerant charge is generally more critical for heat pumps.
Whether the afore-mentioned engineer did the right thing or not, I cannot say. However, using a sight-glass alone can a little risky. If any other part of the system is ‘out of tune’, this could affect the verdict of the sight glass, and could result in a diminished performance. Whilst the risk of this might be low, I have come across more than one system that was grossly over-charged. This causes the condenser (the hot heat-exchanger) to be flooded with refrigerant- effectively leaving a very small working surface area for condensation resulting in damagingly high temperatures and pressures, and poor energy efficiency.
It is hard to say how many repaired systems out-there are given the correct charge, and hard to know if, or how much this translates to a reduction in COP, and I don’t want to worry those who have had repairs carried out; most engineers are both capable and conscientious. On the other hand, I wonder how long the old-school attitude of the refrigeration engineer will plague our heat pumps in the field.
Air conditioning comes somewhere in between refrigeration and heat pumps. Systems are fairly fussy about refrigerant quantity, but bizarrely, to my mind, the pipe connections used are still the old copper ‘flare’ screw-together type. Whilst often a 99% seal, they can leak, and can ‘weep’. Why on earth there is not a requirement to use a more secure pipe joint eludes me.  Surely due to this, there are many air-conditioners and air-air heat pumps that are operating well below of their optimum with a low refrigerant level.  It’s very difficult for the owner to know if a system is energy-inefficient.
To finish my dig at the old-school ways of refrigeration engineers, I fairly recently watched an engineer weigh-in the correct charge of refrigerant. Great I thought, but when he got to the required level (calculated in his head!), he added a bit for luck!  Why did he do this?!  Maybe being helpful to allow for any futures seepage. But this extra amount will potentially reduce the efficiency.  Maybe a fresh look at the importance of getting our systems optimised and energy-efficient is needed.
Since refrigeration issues are rare, it is quite common for a local engineer to carry out the repair on equipment that they have no experience of.  It would be helpful for all manufacturers to provide charts similar the example below to help any engineer to ‘gauge’ if the refrigerant charge is correct without needing to recover and weigh-in. It would also server as a performance health-check for the system. It should be tucked in a plastic wallet inside the unit.